|
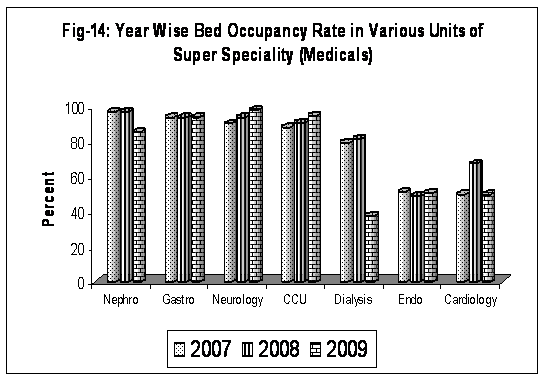
Table-32: Year wise bed occupancy rate in the wards of super speciality Medical Units of Faculty of medicine
|
Wards
|
Bed Occupancy Rate
|
|
2007
|
2008
|
2009
|
|
Nephrology
|
96.2
|
96.7
|
85.05
|
|
Gastroenterology
|
93.3
|
93.2
|
93.37
|
|
Neurology
|
89.6
|
93.5
|
97.62
|
|
CCU
|
87.8
|
90.2
|
94.38
|
|
Dialysis
|
78.9
|
81.4
|
37.56
|
|
Endocrinology
|
50.9
|
48.5
|
50.57
|
|
Cardiology
|
49.9
|
67.0
|
49.88
|
|
Total
|
76.3
|
80.2
|
72.27
|
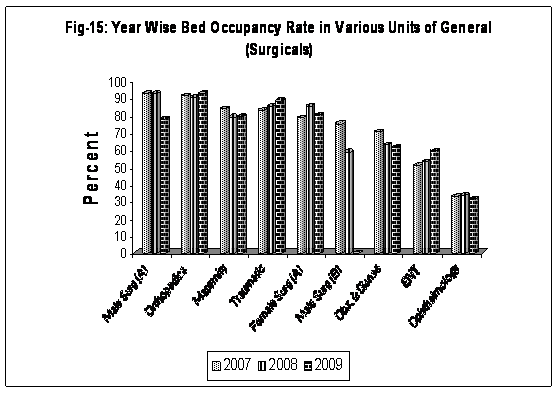
Table-33: Year wise bed occupancy rate in the wards of Surgical Units of Faculty of medicine
Wards |
Bed Occupancy Rate
|
|
2007
|
2008
|
2009
|
|
Male Surgical (A)
|
92.5
|
92.8
|
77.96
|
|
Orthopedics
|
91.0
|
90.3
|
92.43
|
|
Maternity
|
83.6
|
78.8
|
79.12
|
|
Traumatic
|
82.8
|
85.1
|
88.51
|
|
Female Surgical (A)
|
78.5
|
84.9
|
79.78
|
|
Male Surgical (B)
|
75.1
|
58.6
|
*
|
|
Obs. & Ganae
|
70.0
|
62.8
|
61.34
|
|
ENT
|
50.9
|
52.9
|
59.02
|
|
Ophthalmology
|
33.0
|
33.3
|
31.11
|
|
Total
|
72.4
|
71.3
|
72.17
|
* Male Surgical A+ Male Surgical B =Male Surgical Ward
|